Techniques and Tools for Data Visualization
Explore data visualization, tools, techniques, charts, graphs, insights, analytics, software, best practices, storytelling, and trends.
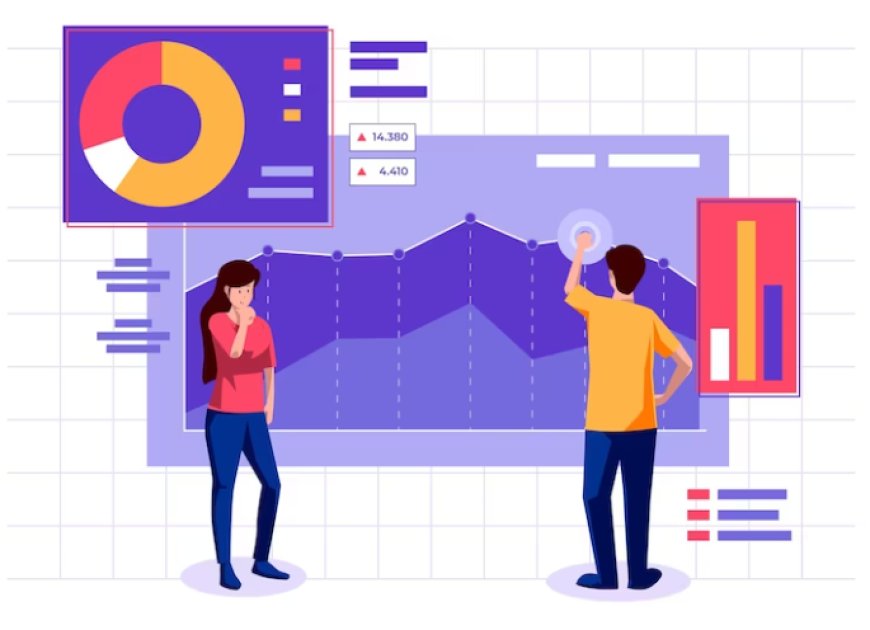
In these days of big data, the ability to extract valuable insights from complex datasets is a crucial skill that sets professionals apart. As organizations struggle to manage vast amounts of information, data visualization has become a vital asset in the field of data science. Far from being a mere decoration for statistical results, data visualization is a powerful tool that transforms intricate datasets into clear and understandable visual stories. It serves as a bridge between raw data and human comprehension, providing a visual language that simplifies the communication of complex information.
To truly navigate the vast realm of data visualization, it is crucial for professionals to view it as a fundamental aspect of data science that goes beyond aesthetics. It serves as a vital tool for effective communication. Data visualization is not just about creating visually appealing charts and graphs; it requires a deep understanding of the intricate relationship between data and design. The choice of visualization techniques, the use of appropriate tools, and the application of design principles all play a pivotal role in transforming raw data into captivating visual narratives. As data science continues to advance, professionals who excel in data visualization not only possess the technical skills to handle extensive datasets but also possess the ability to convey insights that drive informed decision-making with finesse.
As the importance of data continues to grow across diverse industries, the challenge lies in transforming raw, complex datasets into clear, understandable visual narratives. The inherent complexity of data, coupled with the plethora of visualization tools available, presents a significant hurdle for both novices and seasoned professionals alike. The question arises: How can one navigate through The complex environment of data visualization to harness its true potential?
Data Preprocessing Challenges:
Before diving into visualization, one must grapple with data preprocessing challenges. Cleaning and transforming raw data into a format suitable for visualization can be a time-consuming and intricate process. Dealing with missing values, and outliers, and ensuring data consistency are crucial steps in preparing data for effective visualization.
Choosing the Right Visualization for the Data:
The abundance of visualization types can be overwhelming, making the selection of the right visualization for a given dataset a non-trivial task. Understanding the characteristics of the data and the story you want to convey is essential. Incorrect choices can lead to misinterpretation and a loss of the intended message.
Balancing Aesthetics and Information:
While aesthetics can enhance the visual appeal of a chart or graph, it's crucial to strike a balance between aesthetics and information clarity. Extraneous design elements or overly complex visualizations can distract from the key insights, diminishing the effectiveness of the visualization.
Ensuring Accessibility:
Accessibility is often overlooked but is a critical consideration in data visualization. Ensuring that visualizations are accessible to individuals with disabilities is not only ethically important but also necessary for reaching a broader audience. This involves considerations such as color contrast, alt text for images, and keyboard navigation in interactive visualizations.
Data Security and Privacy Concerns:
With the increasing focus on data privacy and security, visualizations must be crafted with caution. Avoiding the unintentional disclosure of sensitive information and ensuring compliance with data protection regulations are paramount. Striking a balance between transparency and privacy is a delicate yet essential aspect of data visualization.
Iterative Nature of Visualization:
Data visualization is seldom a one-time task. As the understanding of the data evolves or as new data becomes available, visualizations may need to be revisited and updated. Acknowledging the iterative nature of visualization ensures that insights remain relevant and up-to-date over time.
Educating Stakeholders on Interpretation:
Bridging the gap between data professionals and stakeholders is crucial. Educating non-technical stakeholders on how to interpret visualizations effectively is essential for ensuring that the insights derived are accurately understood and inform decision-making processes.
Scalability of Visualizations:
Scalability is a consideration when dealing with large datasets or when visualizations need to be integrated into broader systems. Ensuring that visualizations remain effective and responsive, even with increasing data volumes, requires careful consideration of the tools and techniques used.
Version Control for Visualizations:
In collaborative environments, version control for visualizations becomes important. Changes made to visualizations by multiple team members need to be tracked and managed to avoid confusion and ensure the reproducibility of results.
Feedback and Continuous Improvement:
The process of data visualization should be open to feedback. Encouraging a culture of feedback and continuous improvement allows for refinement in visual communication strategies, leading to more effective and impactful visualizations over time.
Amidst the abundance of data visualization techniques and tools, what strategies can be employed to be an expert in transforming raw data into compelling visual stories? How can professionals ensure that their visualizations not only captivate but also convey accurate and meaningful insights?
The Data Visualization Techniques
1. Bar Charts and Pie Charts:
Bar charts are effective for comparing quantities across different categories, while pie charts are useful for displaying the distribution of a whole in relation to its parts. Choosing the right type depends on the nature of the data and the insights one aims to convey.
2. Line Graphs:
Line graphs are instrumental in illustrating trends over a continuous interval, making them ideal for depicting time-series data. They help visualize patterns and identify fluctuations, providing a clear narrative of data evolution.
3. Scatter Plots:
Scatter plots are invaluable for showcasing relationships between two variables. Identifying correlations, outliers, or clusters becomes more apparent, aiding in the interpretation of complex datasets.
4. Heatmaps:
Heatmaps are excellent for representing the magnitude of a phenomenon across two categorical variables. They use color gradients to highlight intensity, making them particularly effective for large datasets.
5. Histograms:
Histograms provide a visual representation of the distribution of a single variable. They are vital for understanding the underlying patterns and characteristics of a dataset, aiding in the identification of central tendencies and variations.
Tools for Visualizing Data
1. Tableau:
Tableau is a robust data visualization tool that enables users to create interactive and shareable dashboards. Its drag-and-drop interface makes it accessible to both beginners and advanced users.
2. Matplotlib and Seaborn (Python Libraries):
Matplotlib and Seaborn are powerful libraries in Python for creating static, animated, and interactive visualizations. With a wide range of customization options, these libraries offer flexibility for diverse visualization needs.
3. Power BI:
Power BI is a business analytics tool by Microsoft that facilitates interactive visualizations and business intelligence capabilities. It seamlessly integrates with various data sources, making it a preferred choice for data professionals.
4. D3.js:
D3.js is a JavaScript library for creating dynamic, interactive data visualizations in web browsers. It provides a high level of control over the final output, making it suitable for customized and intricate visualizations.
5. Plotly:
Plotly is a versatile graphing library that supports various programming languages, including Python, R, and JavaScript. Its interactive plots and dashboards make it a popular choice for data scientists and analysts.
Best Practices for Effective Data Visualization
1. Simplicity and Clarity:
Keep visualizations simple to avoid overwhelming the audience. Clarity should be prioritized, ensuring that the message is easily comprehensible without unnecessary complexity.
2. Consistency in Design:
Maintain consistency in design elements such as color schemes, fonts, and labels across different visualizations. This enhances the overall aesthetic appeal and facilitates seamless understanding.
3. Interactivity:
Incorporate interactive elements judiciously. Interactive features can engage the audience, allowing them to explore data facets that interest them while maintaining the integrity of the overall narrative.
4. Storytelling with Data:
Transform data into a compelling story. Provide context, guide the audience through key insights, and ensure that the narrative aligns with the objectives of the visualization.
5. Responsive Design:
Optimize visualizations for different devices and screen sizes. Responsive design ensures that the visual narrative remains effective across various platforms, enhancing accessibility.
The ability to transform raw data into meaningful insights has become crucial in today's huge data environment. Data visualization plays a key role in this transformation by providing a visual language that can be understood by diverse audiences. By mastering various visualization techniques and utilizing powerful tools, professionals can effectively navigate through complex data and create narratives that inspire understanding and drive informed decision-making. Whether it's a simple bar chart or an interactive dashboard, the art of data visualization empowers individuals to understand the stories hidden within the numbers, making it an essential skill for the data-driven future.
