Statistical Analysis: Concepts and Techniques for Data
Understand statistical analysis, data extraction, techniques, concepts, methods, trends, interpretation, metrics, visualization, insights, accuracy

Welcome to the fascinating world of statistical analysis! In this friendly guide, we will delve into the basic concepts and techniques that form the core of data analysis. Whether you're a student, researcher, or professional, this book will equip you with the knowledge and skills to confidently navigate through the realm of statistical analysis. Let's embark on this exciting journey together!
1. The Power of Statistical Analysis:
Statistical analysis is a powerful tool that allows us to unlock insights and make informed decisions based on data. It helps us uncover patterns, trends, and relationships that are hidden within vast amounts of information. By analyzing data using statistical methods, we can gain valuable insights that can drive impactful outcomes in various fields, from scientific research to business strategies.
2. Key Concepts for Data Analysis:
To understand statistical analysis, we need to grasp key concepts. Populations and samples are fundamental to statistical inference. A population refers to the entire group of interest, while a sample is a subset of that population. By studying a representative sample, we can make inferences about the larger population.
Variables play a crucial role in data analysis. Categorical variables represent attributes or characteristics, such as gender or product categories. Numerical variables involve quantities and measurements, like age or sales figures. Understanding these concepts sets the stage for effective data analysis.
3. Descriptive Statistics: Summarizing and Visualizing Data
Descriptive statistics enables us to summarize and present data in a meaningful way. Measures of central tendency, such as mean, median, and mode, provide insights into the typical or central value of a dataset. Measures of dispersion, such as range and standard deviation, help us understand how the data is spread out.
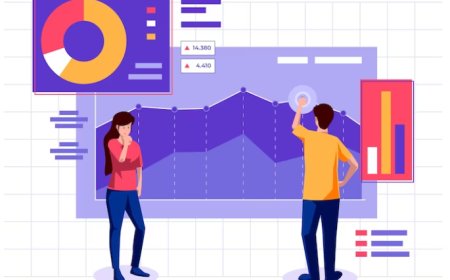
But statistics isn't just about numbers! Visualizing data through charts, graphs, and diagrams brings it to life. Bar charts, pie charts, and scatter plots help us see patterns, identify trends, and spot outliers. These visual representations make complex information more accessible and engaging.
4. Inferential Statistics: Drawing Insights from Samples
Inferential statistics allows us to draw conclusions and make predictions about populations based on sample data. Hypothesis testing is a powerful technique that helps us assess whether observed differences or relationships in our sample are statistically significant. It guides us in determining if our findings are merely due to chance or reflect true patterns in the population.
Confidence intervals provide a range of values within which we can be reasonably confident that the population parameter lies. They give us a measure of uncertainty and enable us to make reliable inferences. These techniques provide the foundation for drawing meaningful insights from data.
5. Common Techniques and Applications in Statistical Analysis
Statistical analysis encompasses a wide range of techniques and applications. Analysis of variance (ANOVA) allows us to compare groups and factors, determining if there are significant differences among them. Correlation analysis helps us understand the strength and direction of relationships between variables, while regression analysis allows us to predict outcomes based on explanatory variables.
Time series analysis enables us to uncover patterns and trends over time, which is essential for forecasting. These techniques equip us with the tools to explore and analyze data in various domains, from scientific experiments to market research.
6. Practical Tips and Best Practices for Successful Data Analysis
Successful data analysis involves more than just applying statistical techniques. It requires attention to practical considerations. Data cleaning and preparation are essential steps to ensure the reliability and accuracy of your results. Removing outliers, handling missing data, and ensuring data integrity are crucial for obtaining meaningful insights.
Sample size and statistical power are critical factors to consider. A sufficient sample size provides more reliable results, while power analysis helps determine the minimum sample size required to detect meaningful effects. Effective communication and visualization of data are equally important. Presenting findings in a clear and engaging manner through reports, dashboards, or presentations ensures that your insights are effectively communicated to others.
7. Advanced Statistical Analysis: Exploring Complex Techniques
For those eager to dive deeper, advanced statistical analysis techniques open up new horizons. Multivariate analysis allows us to examine relationships between multiple variables simultaneously, uncovering complex patterns and interactions. Factor analysis helps identify underlying dimensions and structures within a dataset, providing insights into latent variables. Cluster analysis groups similar observations together, revealing distinct segments or patterns within the data.
These advanced techniques broaden your analytical toolkit, enabling you to tackle complex data analysis challenges with confidence.
Armed with the basic concepts and techniques we've explored together, you are well-equipped to uncover the secrets hidden within your data. Remember, statistical analysis is not a daunting task reserved for experts—it is an accessible and practical skill that anyone can develop.
So, embrace the power of statistical analysis, unleash your analytical potential, and embark on exciting data exploration. Whether you're making scientific discoveries, driving business growth, or making informed personal decisions, statistical analysis will be your trusted companion in navigating the vast sea of data. Happy analyzing!

