


Data Science Tools: R, Python and SAS
Explore essential data science tools - R, Python, and SAS. Unlock insights, analyze trends, and make informed decisions. Enhance your analytical skills
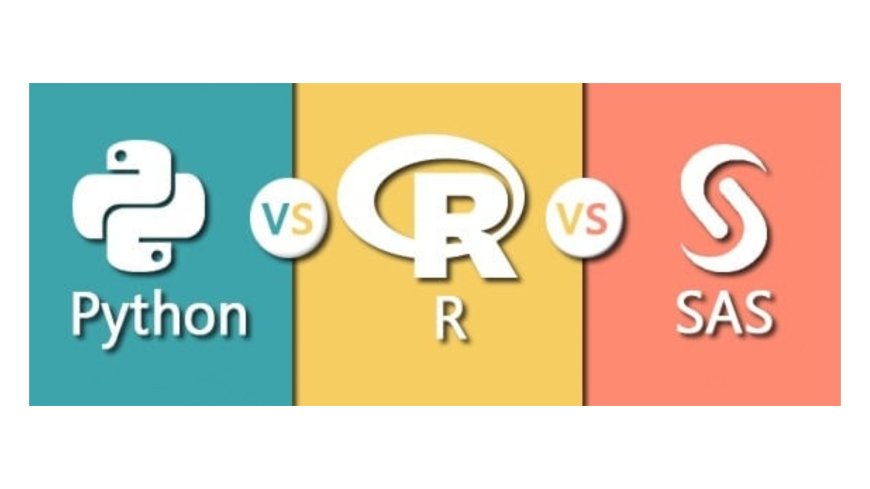
One way to think of data science is as a digital hunt, where valuable insights are discovered from huge amounts of data. To achieve this, data scientists use a variety of tools such as R, Python, and SAS, which can be thought of as keys to throw different data sets. R is particularly adept at analyzing complex data patterns, while Python is versatile and can navigate through various types of data, including those used in machine learning. SAS is a reliable companion that can help businesses decrypt their data and gain valuable insights. Each tool has its own unique strengths, and together they help us better understand the complexities of the digital world.
Choosing the right tool is like finding the perfect match for your data. Each tool, whether it's R, Python, or SAS, has its own unique set of analytic functions. It's all about finding the right fit for the type of data you're working with. For example, SAS is known for its reliability, Python for its versatility, and R for its pattern recognition skills. The key is to understand what kind of data or insights you're seeking. Selecting the most effective tool requires considering what you want to learn and using the magic that best aligns with your goals. R is like a statistical performer, great at identifying patterns in data but may struggle with large datasets. Python, on the other hand, is like a Swiss Army knife, capable of doing a wide range of tasks but may take some time to master. Then there's SAS, solid and dependable, especially for businesses, but not as flexible as the free options. Ultimately, it boils down to what you need the most: statistical analysis with R, versatility with Python, or reliability with SAS. The decision depends on what your project requires and what you feel most comfortable using.
So, what are these tools all about? What makes them special? And how can we pick the right one for the job?
R: Statistical Powerhouse
R is an open-source programming language specifically designed for statistical analysis and graphical representation. Developed in the early 1990s, R has gained immense popularity within the statistical community due to its powerful libraries and comprehensive statistical capabilities.
One of R's significant advantages lies in its rich repository of packages, such as ggplot2 for data visualization, dplyr for data manipulation, and caret for machine learning. The vibrant R community contributes continually to these packages, fostering innovation and flexibility in statistical modeling and analysis. R's steep learning curve can be challenging for beginners, and its performance can sometimes be slower compared to other languages like Python due to its design as an interpreted language.
Python: Versatility and Extensibility
Python, known for its simplicity and readability, has surged in popularity among data scientists owing to its versatility and a large environment of libraries. While Python is not exclusively a statistical language like R, its robust libraries such as NumPy, Pandas, Matplotlib, and Scikit-learn make it a potent tool for data analysis, machine learning, and visualization.
The user-friendly syntax of Python makes it an ideal choice for beginners entering the field of data science. Its versatility extends beyond data analysis, allowing users to create web applications, automate tasks, and work across various domains. Python's integration with other languages and tools, along with its extensive support for deep learning frameworks like TensorFlow and PyTorch, contributes to its widespread adoption in the data science community.
SAS: Enterprise-Level Analytics
SAS is like the big boss of data tools, especially in big companies. It's great for really huge projects, where lots of people need to work together. SAS is super reliable and can handle massive amounts of data, but it's a bit expensive and not as easy to share with everyone.
SAS (Statistical Analysis System) is a proprietary software suite used for advanced analytics, multivariate analysis, business intelligence, and predictive modeling. Widely utilized in industries such as finance, healthcare, and government, SAS offers a comprehensive suite of tools tailored for enterprise-level analytics.
One of SAS's main strengths lies in its reliability, security, and scalability, making it suitable for handling large-scale data and mission-critical applications. Additionally, SAS provides a graphical interface, SAS Enterprise Guide, which simplifies complex analytics tasks for non-programmers.
Choosing the Right Tool
Factors Influencing Choice:
Project-Specific Needs: The selection of the ideal tool among R, Python, or SAS heavily relies on understanding the project's unique requirements. It involves identifying which tool aligns best with the project's objectives, data complexities, and analytical demands.
User Familiarity: The user's proficiency and comfort with a particular tool significantly impact efficiency. Prior experience and expertise in a language can expedite tasks and enhance productivity.
Organizational Preferences: Organizations may have established norms, preferences, or existing infrastructure favoring a specific tool. Adhering to these preferences might streamline collaboration and integration within the organization.
Scalability and Support: Assessing the tool's scalability and the availability of adequate support resources is crucial for ensuring successful project execution and future expansion. This involves considering the tool's ability to handle larger datasets and the availability of community or professional support.
R's Statistical Dominance:
Academic & Research Relevance: R's stronghold lies in academia and research domains, particularly in tasks emphasizing statistical analysis. Its specialized packages cater effectively to researchers and statisticians.
Robust Statistical Packages: The extensive suite of statistical packages within R empowers users to conduct intricate statistical analyses with comprehensive functionalities.
Community Engagement: The active and engaged R community plays a pivotal role in augmenting and refining its statistical capabilities. Continuous contributions and updates enhance its statistical prowess.
Python's Diverse Applications:
Versatility Across Industries: Python's appeal extends beyond statistical analysis, serving diverse applications across industries. Its versatility covers machine learning, data visualization, web development, and more.
Accessibility and Learning Curve: Python's beginner-friendly nature and intuitive syntax make it approachable for new learners, attracting a wide user base. Its large community support aids in learning and problem-solving.
Adaptable Functionality: Python's adaptability allows data scientists to address multifaceted tasks effectively. Its extensive libraries facilitate tasks beyond statistical analysis, fostering innovation and flexibility.
SAS's Stability and Compliance:
Regulated Industry Preference: SAS stands out in industries emphasizing robust, secure, and scalable analytics solutions, particularly in regulated environments. Its compliance with stringent standards makes it a preferred choice.
Reliability and Security: SAS's reputation for reliability and security reinforces its position in environments valuing stability and data integrity. It offers a dependable platform for critical analytics tasks.
Choosing the perfect tool for our data adventure is crucial, and it all comes down to the type of journey we're starting on. If our focus is on delving into statistics and creating visually appealing graphs, then R might be the ideal choice. However, if we desire a versatile tool that goes beyond statistics and offers a friendly user experience, Python is an excellent option. On the other hand, when dealing with complex tasks within large companies, SAS becomes the main character. By understanding the unique strengths of each tool, we can confidently select the one that best suits our data journey, making the world of data science both thrilling and manageable!